
Chartwell is a national leader in financial advisory, serving the unique needs of privately held middle-market companies. Our construction practice serves more than 200 industry clients of various sizes and specialties across the country with a focus on long-term business success.
This newsletter focuses on current industry trends, public market performance, and M&A activity within the construction sector. Chartwell’s expertise across the finance spectrum provides us the unique ability to provide comprehensive, unbiased, solutions-based advice.
Construction Activity Indicators
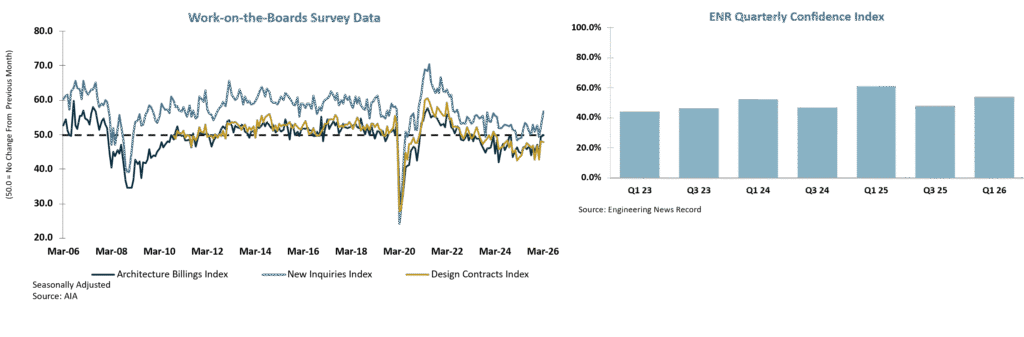
The AIA’s architecture billings index (“ABI”) has been below the growth neutral level of 50.0 since April 2023 but rose from 43.8 in January 2026 to 49.4 in February and 49.8 in March. The Work-on-the-Boards survey’s new project inquiries index fell from 52.6 in December 2025 to 49.3 in January 2026 (the first reading below 50.0 since registering 49.0 in April 2025) but rose to 52.3 in February and 56.8 in March. The new design contracts index has been below 50.0 since March 2024 and stood at 47.8 for March 2026. This represents an increase from 46.7 in December 2025 and 42.7 in January 2026, though down slightly from 48.0 in February.
ENR’s Construction Industry Confidence Index rose two points to a 54.0 rating in the first quarter of 2026, continuing a slow but steady climb that has added seven points since the second quarter of 2025. While confidence in current and near-term market conditions (3 to 6 months out) remains strong, executives are growing more cautious about the longer-term outlook. The share of respondents expecting an improving market in 12 to 18 months dropped from 53.5% in the fourth quarter of 2025 to 44.0% in the first quarter of 2026. Confidence also varied sharply by firm size as firms with $250.0 million or more in revenue reported a 61.0 rating, while those with under $50.0 million came in at 43.0.
Construction Public Company Index
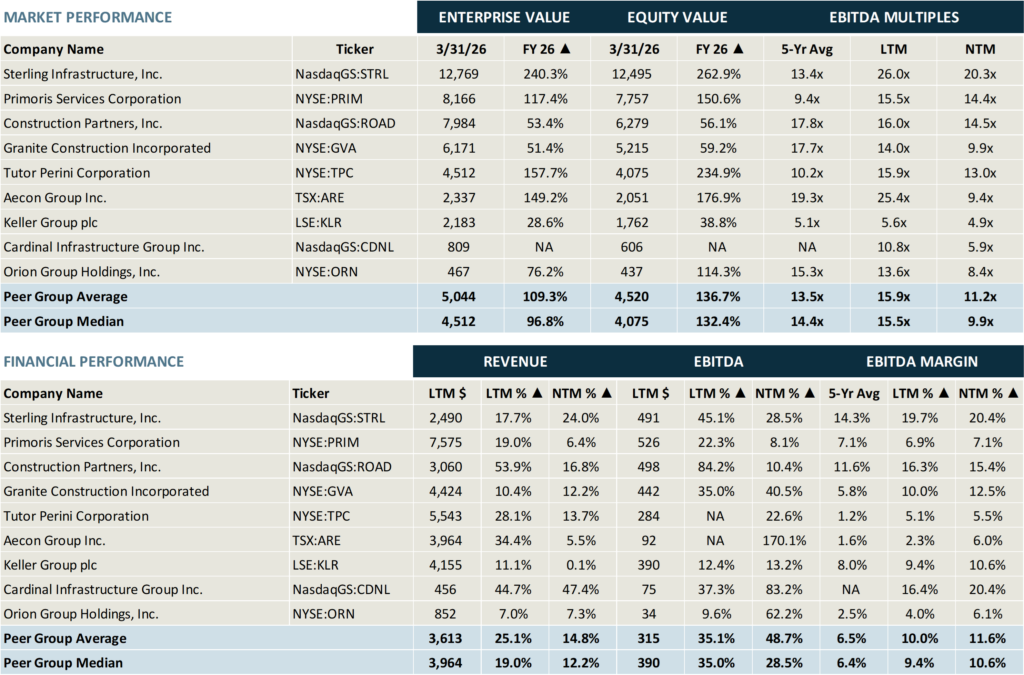
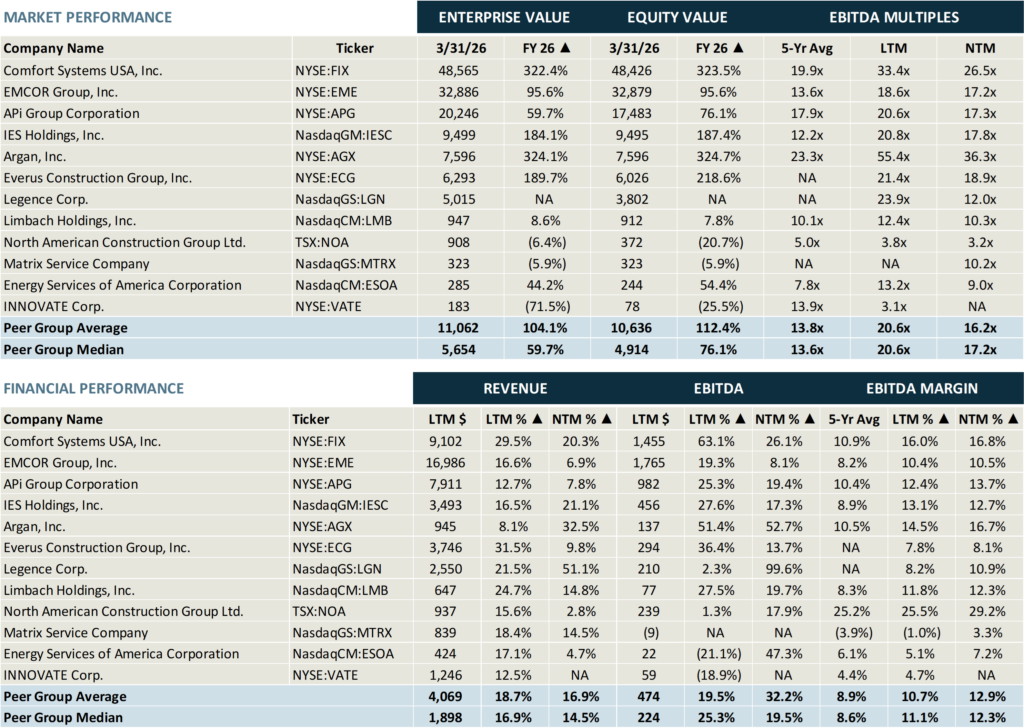
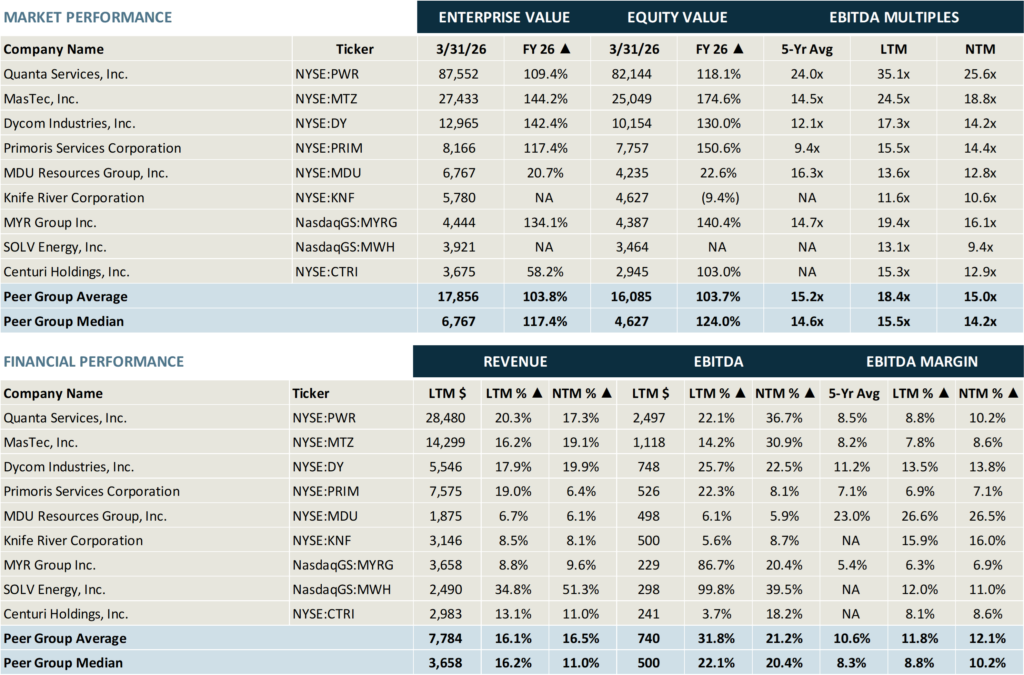
Chartwell’s Construction Index (“Construction Index”) is comprised of 31 unique companies representing a broad cross-section of firms in the commercial construction industry (excluding homebuilders). While many of these companies have multiple service lines, our focus is on firms that generate the majority of their revenue from contracting services. The Construction Index is further categorized into the General Contracting (“GC”) Peer Set, Civil Peer Set, Specialty Peer Set, and Utility Peer Set, as detailed on the following page.
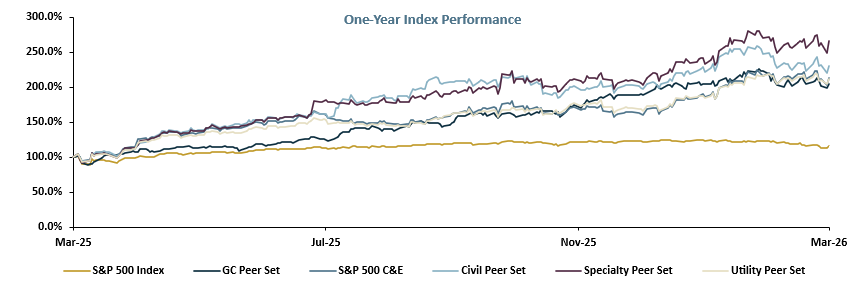
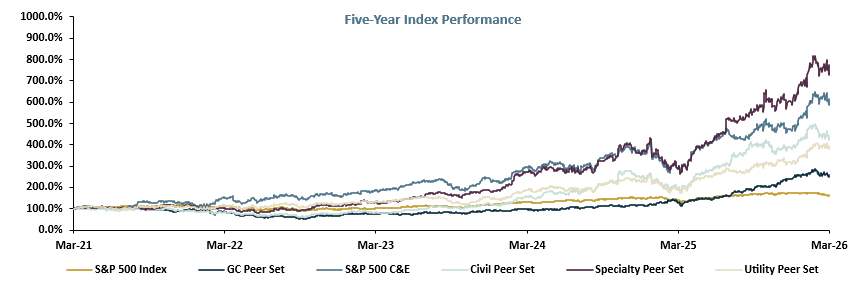
The S&P Construction & Engineering (“C&E”) Index outperformed the S&P 500 Index during the past year driven by significant investment in infrastructure and industrial projects resulting in strong earnings growth. Notably, each of the Peer Sets within the Construction Index also surpassed the S&P 500 Index led by the Civil, Specialty, and GC Peer Sets, which continue to benefit from infrastructure funding, grid modernization, and data center development.
In general, companies in the Construction Index performed well during the twelve months ended September 30, 2025 with median EBITDA growth of 26.7%. While individual company performance varies based on industry and end market concentration, market expectations for member companies remain strong as nearly all companies with estimates are expected to achieve EBITDA growth during the next twelve months, resulting in median growth of 24.6% for the index.
The median EBITDA margin of the Construction Index totaled 8.7% for the twelve months ended September 30, 2025 and all but one member generated positive margins during the past year. Expectations for profitability remain strong as the median EBITDA margin for the next twelve months is expected to total 10.3%, above the median five-year historical average EBITDA margin of 7.7%.
Analyzing multiples continues to be a challenge, especially given broader market volatility during the first three quarters of 2025. The latest median EBITDA multiple for the Construction Index of 16.0x is up from 13.4x a year earlier and compares to 13.0x averaged over the past five years. When reviewing the companies individually, record contract backlogs and tailwinds related to artificial intelligence and infrastructure investment have fueled growing investor confidence.
The median EBITDA margin of the Construction Index totaled 8.7% for the twelve months ended September 30, 2025 and all but one member generated positive margins during the past year. Expectations for profitability remain strong as the median EBITDA margin for the next twelve months is expected to total 10.3%, above the median five-year historical average EBITDA margin of 7.7%.
Analyzing multiples continues to be a challenge, especially given broader market volatility during the first three quarters of 2025. The latest median EBITDA multiple for the Construction Index of 16.0x is up from 13.4x a year earlier and compares to 13.0x averaged over the past five years. When reviewing the companies individually, record contract backlogs and tailwinds related to artificial intelligence and infrastructure investment have fueled growing investor confidence.
Construction Index – General Contractors

Construction Index – Civil Contractors
Construction Index – Specialty Contractors
Construction Index – Utility Contractors
Construction M&A Activity
For more information about Chartwell’s construction practice and financial advisory services, contact Managing Director & Construction Vertical Lead Collin Mayer.